


India Policy Watch #1: Why We Don’t Care About Growth
Insights on burning policy issues in India
— RSJ
Earlier this week, Pranay and I recorded an episode with Shruti Rajagopalan for her podcast Ideas of India. I have been following Shruti’s columns and the podcast for a while now, and I will recommend you subscribe to both her podcast and her newsletter. She’s always insightful, curious and uses first principles to probe issues. This means you cannot get away with the usual stock answers. One of the questions we discussed at length was why does the Indian electorate not prioritise growth while making their choices at polls. It is an interesting contention whose premise itself can be questioned. How can we conclude that they don’t? And then, if we assume for a moment they don’t, why do they not?
I won’t spoil your experience of listening to the episode by going into the details of what we discussed. But I will cover some ground in today’s edition on why it seems that people in India don’t care about economic growth. And as it often happens in life, this discussion happened in the same week when India published its GDP estimates for the quarter Oct-Dec, 2022. So what I will do today is cover the data released by the National Statistical Office (NSO), take a wider view of what’s happening with the economy and round it off with that question that Shruti asked.
Here’s the headline news on growth: From the ET:
“India’s gross domestic product (GDP) for the October-December quarter moderated to 4.4 per cent from 6.3 per cent in the previous quarter, data shared by the Ministry of Statistics and Programme Implementation showed on Tuesday. The GDP has now moderated from 13.5 per cent in the first quarter of FY23 largely due to pandemic-related statistical distortions.
Lower GDP growth can also be attributed to aggressive rate hikes by the Reserve Bank of India in order to tame the high inflation. In addition to these factors, the slowdown in exports and consumer demand has also contributed in bringing down the numbers. The dent in consumer demand can be linked with the bullish rate hikes by the central bank to bring down inflation in the past few months. Meanwhile, slowdown in external demand could be a consequence of the rate hikes by major central banks around the world.”
Apart from this, the NSO made revisions to the GDP numbers for FY 22, FY 21, FY 20 and to the first two quarters of this FY. Heh! I’m reminded of that famous quip by a former RBI Governor, ‘In other countries the future is uncertain, but in India even the past is uncertain’.
The growth numbers came in as a negative surprise. What’s worse, manufacturing showed a contraction for the second quarter in a row. Not a great sign when the government has been pushing for companies to set up a base in India and eyeing that ‘China+1’ pie.
The WSJ had a summary of the key signs of worry in the Indian economy:
“Weakness in private consumption stood out the most. India’s private consumer spending, which comprises about 60% of India’s gross domestic product, rose just 2.1% year over year, compared with an 8.8% increase in the September quarter. It was mainly hurt by higher interest rates and elevated inflation. Slower growth in rural spending after some pandemic-era subsidies were cut could have also played a role.
A closer look at other numbers in the GDP data also paints a worrisome picture. Import growth fell more sharply than export growth, again signalling weak domestic demand. And while fixed investment growth was a relative bright spot, it still slowed for the second quarter in a row.
Nomura economists Sonal Varma and Aurodeep Nandi think markets are still significantly underappreciating the risks to India’s growth. They say the country’s growth cycle has peaked, and a combination of weaker global growth and tight domestic and global financial conditions could spell further trouble for exports, investment and discretionary consumption.”
So, what should one make of this data? There’s clearly a moderation of growth. Some of it is expected because of the base effect of the pandemic years and the upward revision to growth done for the previous years. It is also true that global demand is weak, so exports will be sluggish for a while. On the other hand, manufacturing growth remaining weak despite all the PLI and ‘Make in India’ efforts should worry policymakers. Domestic consumption is starting to feel the impact of rate hikes, and the liquidity situation remains tight. Of course, the data can be spun the other way too. The NSO has maintained its 7 per cent growth forecast for the full year, which implies a 5.1 per cent growth in Q4. Inflation is subsiding, and it is likely that after the potential April rate hike, we will have a pause unless global factors come into play. Also, an expected good monsoon and China opening up post its Zero Covid madness will mean domestic and global demand will be back. So, it is all a mixed bag if you just go by quarterly numbers.
I thought it might make sense to look at the long-range data from NSO/CSO and other sources to reach better conclusions than merely reacting to quarter-on-quarter figures. Here’s what I learnt:
The primary growth driver since 2015 (keeping the pandemic years aside) has been an increase in factor productivity. When compared to the previous decade, the contribution of capital to growth has come down. Simply put, while we have grown at a 6.5-7 per cent annual rate since 2015, which is similar to what we had between 2005-14, the composition of growth is different. We have become more productive, but we haven’t added new capacity to our economy as fast as we did earlier. The good news is factor productivity growth is difficult to achieve, and we have done that. All that talk of digital infrastructure seems to be working. Now, can we reverse capital formation? That’s the next point.
Will there be a long-delayed capex boom as has been promised by the government in the last two budgets? The debt to GDP has remained stagnant now for a decade. The total banking sector credit to GDP ratio has been range-bound between 50-55 per cent during this time. Why will it change now? First, the corporate debt to equity and debt to EBITDA are at their lowest right now in over 15 years. The demand for credit from corporates is linked more to the health of their balance sheet than their income statements. The Top 500 companies are sitting on the strongest balance sheets ever right now, and sometime soon, they will have to start believing in what they say at all these business conclaves about India’s time being now. Second, there is significant deleveraging in the banking system, and the leverage (assets/equity ratio) among banks is at a multi decade low. Combine this with a decade long real estate slump which is showing signs of turning despite higher interest rates, the mix is right for the capex cycle to start.
Lastly, there are two real risks facing the economy when you go beyond the immediate numbers. The debt to GDP numbers remain elevated at 85-90 per cent range, and the government continues to crowd out others in the debt market. There is some consolidation, as was seen in this budget, but the government has to stay on course to reduce the fiscal deficit and bring the debt-to-GDP ratio back to the 70 per cent handle. The other risk is on the balance of payments (BoP) which will remain in deficit for the foreseeable future. Exports have slowed, and the tightening of the rate differential between India and the US will lower the risk appetite which will impact capital inflow. A longer duration BoP deficit puts India at risk in case of an ‘accident’ in the global market.
Anyway, you might think Q3 data or a longer-term view of the economy at the moment should trigger a debate on the economy in the media. That people on the street would be interested in knowing how the government would tackle this, and it should be an important discussion point in mainstream media. But there’s none of that anywhere. That leads me back to Shruti’s question on why economic growth is not a critical subject of public discourse in India. Pranay and I had three hypotheses for this.
First, it is not entirely true that growth isn’t a political issue in India. There’s been a steady rise in people’s expectations of economic growth from the government. State elections are fought on an economic plank more often than not. Almost every party speaks of ‘vikas’ without fail. Also, the fact that successive governments see the need to revise (or fudge) growth numbers suggest, in a perverse way, that they know people care about this stuff now.
Second, it is true that people in India still don’t correlate their immediate economic prospects with the policymaking of the government in power. The only economic indicator that bothers people and that they link back to the government is inflation. And that explains why governments tend to be sensitive to price rise data. Also, with the private sector becoming the primary source of new job creation, people tend to blame them for job creation or losses. The question of why the government doesn’t facilitate policies that help the private sector invest and create more jobs isn’t of immediate concern to people.
Lastly, any discussion on economic growth in India devolves quite quickly to two notions that lots of Indians hold as true. One, we are gifted with the best resources and the best people, so we just have to announce to the world that our time has come, and they will flock to us. This has been exacerbated by a steady stream of global Indians doing well with leading global organisations. So, we think we have a birthright to be a vishwaguru. The WhatsApp forwards certainly don’t help in tempering this skewed notion. The problem is this image then confronts the reality of our performance - low per capita income, poor human development parameters, shoddy infrastructure and economic underperformance. This leads our people to the second notion. That the only reason we aren’t growing like we rightfully should is because there’s some mysterious force stopping us. And this something is easily spun in elections as some other group, some group of ‘them’ saboteurs derailing India versus the ‘us’ who are trying our best. Almost every growth discussion in India goes down this predictable path - start with asking what will spur more growth, refuse to engage with real issues like factor reforms, inefficient and large footprint of the state, complex tax structure etc., and, soon, come down to who or what forces are stopping us from growing? From there, the discussion is easier, politically speaking. Find the ‘other’. And damn them. This has been the script for over half a century now. As we speak today, the other is either some leftist, global cabal out to sabotage India’s inevitable rise or the minority community in India who don’t care about growth or progress.
There is a likelihood that as income and awareness levels go up, people will draw the link between economic performance and governance and demand better. But this natural progression is up against a concerted narrative and a pliant media that isn’t interested in helping explain this link or asking the tough questions. So, we continue to have the spectacle of prime-time debates saturated with all sorts of non-issues on the day when GDP numbers are published.
It is easier to blame someone for a problem than to solve it.
Addendum
— Pranay Kotasthane
It’s telling that there are very few recent papers that investigate the link between economic growth and electoral outcomes. But the few that I could find suggest the link between economic growth and political dividends is improving. A 2015 paper by Milan Vaishnav and Reedy Swanson tested this relationship in the period 1980-2012 for major state elections. In the aggregate, there was no statistically significant relationship between growth and electoral performance. But, the picture was different when they looked at just the recent twelve-year section of the study period (2000-2012). Incumbents were rewarded for higher growth, and the relationship held true after controlling for other factors. Contrary to popular belief, they found that inflation didn’t impact electoral outcomes, but economic growth did.
Another recent paper from 2019 by Bang & Mishra contends that sectoral growth matters more than aggregate growth. Specifically, the agricultural growth rate can propel electoral performance, while services sector growth has no such effect. The paper didn’t explain the methodology used, so we should interpret the results with caution.
My own unsubstantiated assertion is that the period of fast growth was so short (2003-2008) that it doesn't register as a benchmark in voter decisions. Our reference points are far lower. Middling rates of economic growth without excess volatility are enough to convince us that we are going in the right direction. We might be subconsciously extrapolating this growth rate linearly, hence allowing other factors to outweigh our electoral decisions.
Regardless, we need a lot more empirical studies to decode this puzzle.
A Framework A Week: A Taxonomy of Policy Failures (and Policy Successes)
Tools for thinking about public policy
— Pranay Kotasthane
Policies can fail due to different reasons. These reasons and diagnostic tools are scattered across several editions of this newsletter. In this edition, I will compile these tools so that we have a single meta-framework for analysing policy failures.
The idea is that whenever you witness a policy failure, one of these menu items might help you diagnose it. A word of caution: this taxonomy is neither mutually exclusive (some failures might span multiple frameworks) nor collectively exhaustive (there definitely are other reasons I’ve not read yet). Nevertheless, it is a useful collection, I think.
Framework 1: The Programmatic - Political Axes
We discussed this framework in edition #147. It assesses policy success on two parameters - programmatic efficiency & effectiveness, and political coalition building & communication. The 2x2 matrix below presents four stylised scenarios.

The use of the “political work” axis highlights that judgments on policies are often subjective. They are “constructed” in our minds as much as they are outcomes of good craft work. That’s why narratives are crucial in policy-making.
Framework 2: A Fourfold Measure
Another framework that we covered in edition #147 builds on the previous framework and devises four parameters of success/failure in order to eliminate getting swayed by narratives alone.

Broadly speaking, Programmatic Assessment measures the Effectiveness and Efficiency of a policy. Process Assessment indicates Implementation Capability. Political Assessment measures narrative power.
Framework 3: Unpacking Success and Failures
Allan McConnell’s paper Policy Success, Policy Failure and Grey Areas In-Between, classifies policies along a spectrum in each of the first three dimensions from the previous framework. The spectrum has the following shades: outright success, resilient success, conflicted success, precarious success, and, finally, outright failure. For instance, here’s how this spectrum would look along the Political dimension.

This framework helps policy analysts identify contradictions between the different dimensions of policy failures. Some policies might be successful along one dimension but might fare poorly along another. McConnell identifies three typical contradictions:
Successful Process vs Unsuccessful Programmes. These are policies which follow well-established methods of deliberation, such as parliamentary debates, standing committee suggestions, and excellent law drafting. And yet, they might fail as a programme, i.e. they do not achieve the stated goals, and their costs far exceed the benefits. I put policies such as Items Reserved for Manufacture Exclusively by the Smallscale Sector under this category.
Successful Politics vs Unsuccessful Programmes. These are electorally popular policies that governments want to associate with long after their consequences have played out. Yet they fail to achieve the stated goals and impose far higher costs than intended benefits. Probably, the Bombay Rent Control Act and Corporate Social Responsibility Act fall into this category.
Successful Programmes vs Unsuccessful Politics. Until about a year ago, I would have classified the Civil Services Pension Reform of 2004 as an outright success along all dimensions. But with five states having gone back on it already, it’s become a classic case of poor coalition-building.
There’s another common contradiction: Successful Programmes vs Temporal Failures. These are programmes that achieve short-term goals but lead to adverse unintended consequences in the long term. Minimum Support Prices policies for grains and the Bombay Prohibition Act fall under this category.
Framework 4: Outlays - Output - Outcomes
We discussed this framework in edition #98.
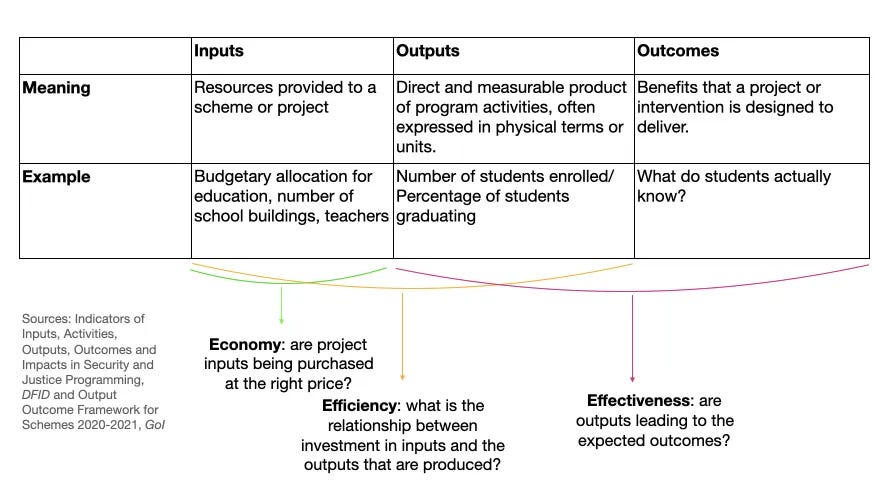
Inputs/Outlays refer to the resources provided to a scheme or project that the government runs. Outlays for a project is no guarantee for success. To measure success, policies or schemes need two other parameters: outputs and outcomes. Outputs refer to the direct and measurable product of program activities, often expressed in physical terms or units. Outcomes, on the other hand, are the long-term benefits that a project or intervention is designed to deliver.
…
This framework also yields a useful vocabulary for measuring success. We can assess policies in terms of its economy, efficiency, and effectiveness. Economy refers to inputs. It answers the question: are project inputs being purchased at the right price? Efficiency relates to outputs over inputs. It answers the question: what is the relationship between investment in inputs and the outputs that are produced? Effectiveness relates to outcomes over outputs. It answers the question: are outputs leading to the expected outcomes?
This framework can help disambiguate implementation failures from “theory of change” failures. Often, implementation failures are caused due to insufficient outlay allocation or corruption, which impedes the conversion of outlays into commensurate outputs.
In the case of “theory of change” failures, the assumed linkage between outcomes, outputs, and outlays is found to be incorrect. For example, the theory of change in education policies continues to be that more outlays on government schools and on teacher salaries will result in higher student enrollments, which would eventually lead to better learning outcomes. This linkage doesn’t hold strongly, as ASER surveys have shown year after year.
What we think of as implementation failures often turn out to be “theory of change” failures under the hood.
Framework 5: Violating the Tinbergen Rule
Editions #9 and #135 talk about this failure. The more the number of objectives that a policy or institution is supposed to achieve, the more likely it is to fail in achieving any of them. A classic case of failure is that of the traffic police in India — burdened with regulating traffic while its main function is enforcing adherence to traffic rules and regulations.
Policies that seek to achieve many goals should raise the alarm in an analyst’s mind.
Framework 6: Incentive Interference
The mother of all policy failures is, of course, ignoring people’s preferences and incentives. Bans, price caps, sticky subsidies, and high tax rates meddle with choices and preferences to such an extent that they are almost always counterproductive.
HomeWork
Reading and listening recommendations on public policy matters
[Article] It is easy to get swept away by the government’s rhetoric on industrial policy. So it was a relief to see the Minister of State in MeitY strike a cautionary note about PLI schemes in a Mint report:
“Think of PLI as the period during which we are transitioning from a less than fully competitive economy to a fully competitive manufacturing (economy). So the PLI will take care of that interim period. But the economy, the efficiency, the competitiveness, the skills, the logistics, costs, all of that will eventually kick in and make us competitive".
As we keep saying, PLI is probably a necessity in today’s geopolitical scenario, but it is hardly the solution to our economic woes. There was another article in the Financial Times on similar lines.
[Podcast] Over at Puliyabaazi, we spoke with senior journalist Seema Sirohi, who has closely tracked the India-US relationship for over three decades. Her book Friends with Benefits: The India-US Story is a must-read for anyone interested in this subject.
[Article] Check out S Dinakar’s Business Standard piece to know why the Russian crude oil discount is not reflecting in your petrol pump bill. It’s a classic case of government price-fixing, using a benchmark that saves government-owned refineries at the cost of consumers.


Share this post